
Wind and Solar Power Forecasts
Our services for the energy industry
- CONTENT
- Wind and Solar Power Forecasts
- Curtailment Forecast
- Meta-Forecast
- Situational Awareness Report
- Customer Portal
- Use Cases
- News
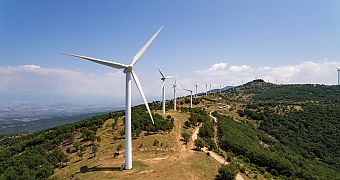
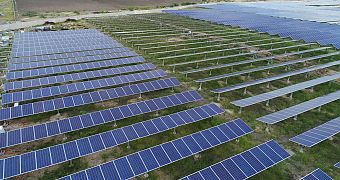
As wind and solar power installations continue to expand, meteorological conditions gain a fundamental influence on energy production. Solar irradiance and wind speed determine the volume and composition of wind and solar power production, renewed at every moment.
As experts in the interface between meteorology and the power economy, energy & meteo systems delivers groundbreaking solutions for precise predictions, marketing, and grid integration from fluctuating wind and solar power. Currently, we deliver worldwide power forecasts for solar and wind power plants with a total installed capacity of around 500 GW.
In addition to the individually customized forecasting services listed here, we offer grid and plant operators as well as power traders the following services:
- real-time projections for solar power, including behind-the-meter generation
- grid-oriented forecasts (vertical grid load forecasts and dynamic line rating)
In furthering the goal of efficient monitoring and data management, we present our web-based customer portal, allowing you to capture your measurement and prediction data at a glance. We offer power predictions according to your specifications and our 24/7 on-call service is at your disposal should the need arise.
Are you interested in our wind and solar power predictions and further energy forecasting services?
Give us a call: Tel. +49 441 / 249 210 or [email protected]
Flyer: Forecasts and Nowcasts
Wind and Solar Power Forecasts
Previento & Suncast: reliable power predictions
Precise forecasts of wind and solar power generation for power traders, plant and grid operators belong to our core competencies. With our prediction systems Previento and Suncast, we deliver precise forecasts of the wind and solar power input for any on- and offshore sites worldwide as well as for control zones and grid node levels. By optimally combining weather models, we predict power output from 5 minutes to 15 days in advance at a high time resolution and with a very short-term adaptation to online measurements.
Whether you are an energy provider, power trader or grid operator, Previento and Suncast can efficiently integrate the fluctuating input from wind and solar energy into your daily business both technically and economically.
Operational wind and solar forecast systems
In order to calculate a qualified solar or wind power forecast, Previento and Suncast utilize numerical data from all leading weather services, making use of their individual strengths. The complex calculation model applied here obtains a high degree of forecasting accuracy through the optimal combination of various weather models, together with the integration of the surrounding wind and solar farm terrain.
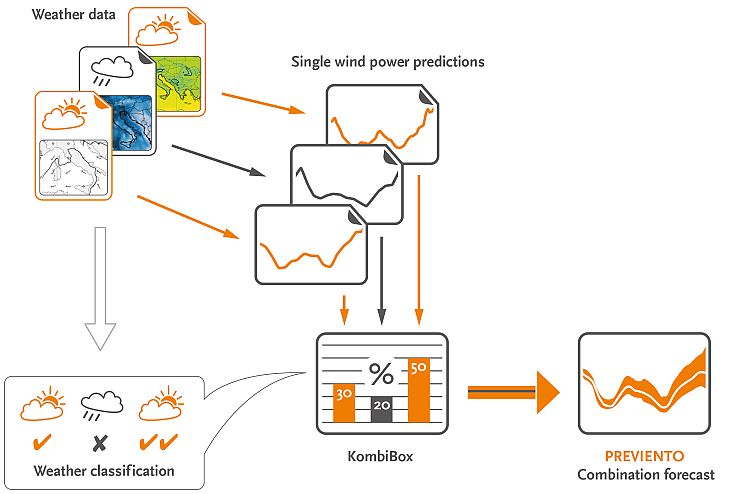
Our time-tested KombiBox procedure gives a higher priority to those forecasts having the lowest prediction error in a respective weather situation.
Moreover, Previento and Suncast calculate the uncertainty associated with a given prediction situation, in addition to the actual prediction value. This is because the accuracy of forecasts varies according to the weather situation.

Extreme weather conditions and curtailment
Our power forecasts are constantly optimized for difficult weather conditions or extreme situations, among these fog, snow or Sahara dust and cold-fronts, convection currents or instability. Other factors influencing power production are also factored in, such as shutdowns due to night-time, storms or bats, as are installation power consumption, market curtailment and curtailment on the part of the grid operator.
Curtailment Forecast
Consideration of curtailments

Our forecasts are characterized by their modular structure, i.e. custom power predictions can be optionally included as modular "building blocks". A crucial building block is our curtailment forecast. Here, the input curtailment of renewable energies by the grid operator due to bottlenecks in the control zone (feed-in management) is taken into account. We therefore always offer two variants of our forecasts:
In the forecast of the actual power output, all power reducing curtailments due to feed-in management curtailments from grid operators, as well as technical (e.g. maintenance, turbine defects) and scheduled availability (e.g. night-time shutdowns, shadow casting) are considered.
The forecast of the technically possible power output only accounts for all technical and scheduled availability. Market-based shutdowns as well as feed-in management curtailment are not calculated in this case.
In order to validate the curtailment forecast, curtailments published by the distribution and transmission grid operators are incorporated. Curtailment predictions are available on many separate levels, e.g. individual farms, portfolios or countries.
Meta-Forecast
Combination of different providers
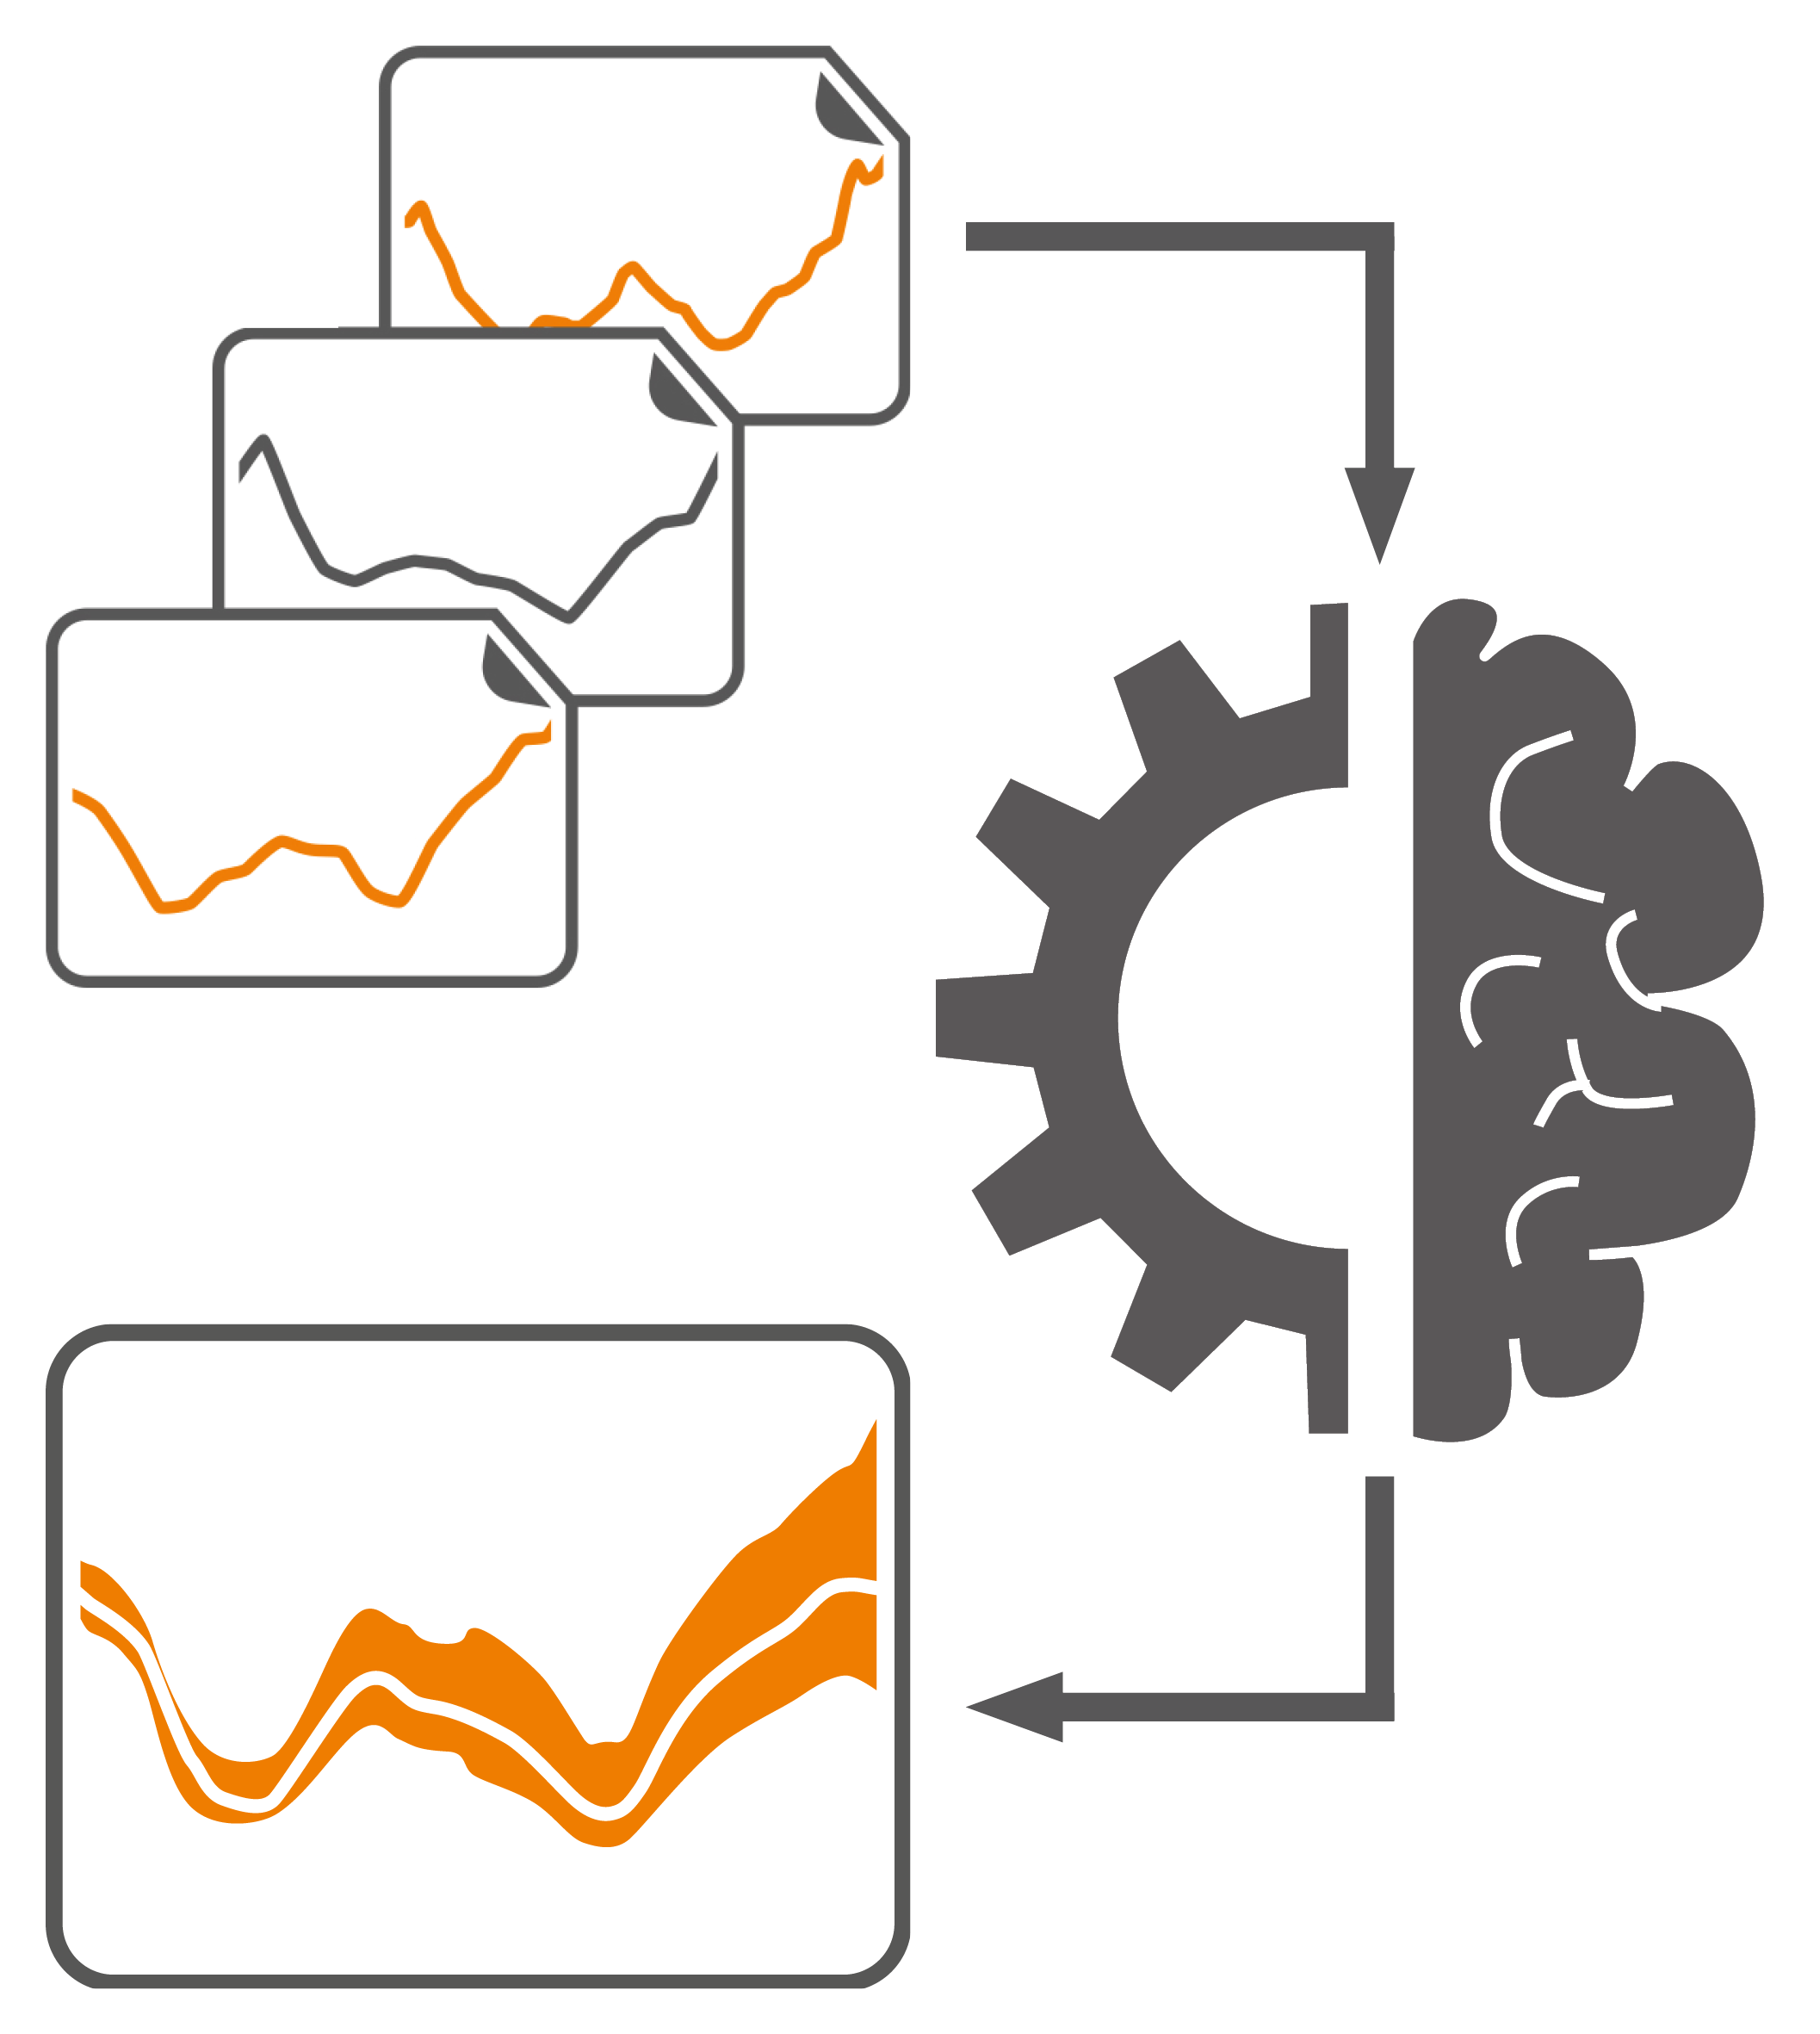 There is also the possibility of combining our prediction models with those of other providers. For this purpose, our meta-forecast determines the optimal statistical weights with the help of the quality of the model's historic performance. The determination of the weighing factors can take place automatically or manually.
With an additional short-term correction, it is also possible to react optimally to weather-dependent changes in the model combinatorics, which also enables a high forecast quality in difficult weather conditions. Even for long-term forecasts with a horizon up to four days, the use of our meta forecast ensures an above-average prediction quality.
Situational Awareness Report
Meteorological forecast
 Our meteorological forecast and additional situational awareness reports prepare grid operators and direct marketers in advance for extreme weather situations.
Real-time warning reports make information available fast and effectively, particularly in critical situations such as storms, icing, fog, lightning or Sahara dust, where the supply feed from renewable energies can be very uncertain.
Customer Portal
Visualization of data
 With the easy to use customer portal, prediction and measurement time series data can be visualized in diverse ways and grouped into individual overview screens, so-called dashboards. In addition to graphs and gauge displays, maps and scatter plot representations are also available. Displayed data can be exported and downloaded via the customer portal.
The latest notifications of weather events and meteorological forecasts reach our customers directly through the integration of our alert services, EmsCom. Reports and other documents are centrally located and can be viewed directly in the browser. The possibility of freely customizing reference time frames for time series data in order to view historical data rounds out the functionality.